Did you know you can help your CFO sleep better at night?
Here’s how:
❌ Bore them with millions of data points and charts.
✅ Help them understand and influence financial performance.
Today’s topic is how to calculate 3 KPIs your CFO cares about.
We’ll cover the following:
- What keeps your CFO awake at night
- Why KPIs are key to your company’s success
- How LESS data equals MORE financial handle
- 3 KPIs to focus on and how to calculate them
- How to tell your KPI story
Let’s dive right in.
Why This Matters
Your CFO wants financial handle.
Financial handle is when you understand and have control over your company’s long-term financial performance.
Help them do that and they’ll sleep a little better.

In the process, your FP&A career will get a BIG reputation boost.
But what actually keeps your CFO awake at night?
What Keeps Your CFO Awake at Night
CFOs have plenty on their mind:
- Cash flow
- Risk management
- Compliance
- Cost control
- Revenue targets
The list goes on.
These responsibilities can make even the best CFOs want to pull their hair out.

The trick is helping your CFO organize their thoughts to feel informed and in control.
Control is the critical keyword here.
The best way to achieve this?
Through numbers.
Why KPIs are Key to Your Company’s Success
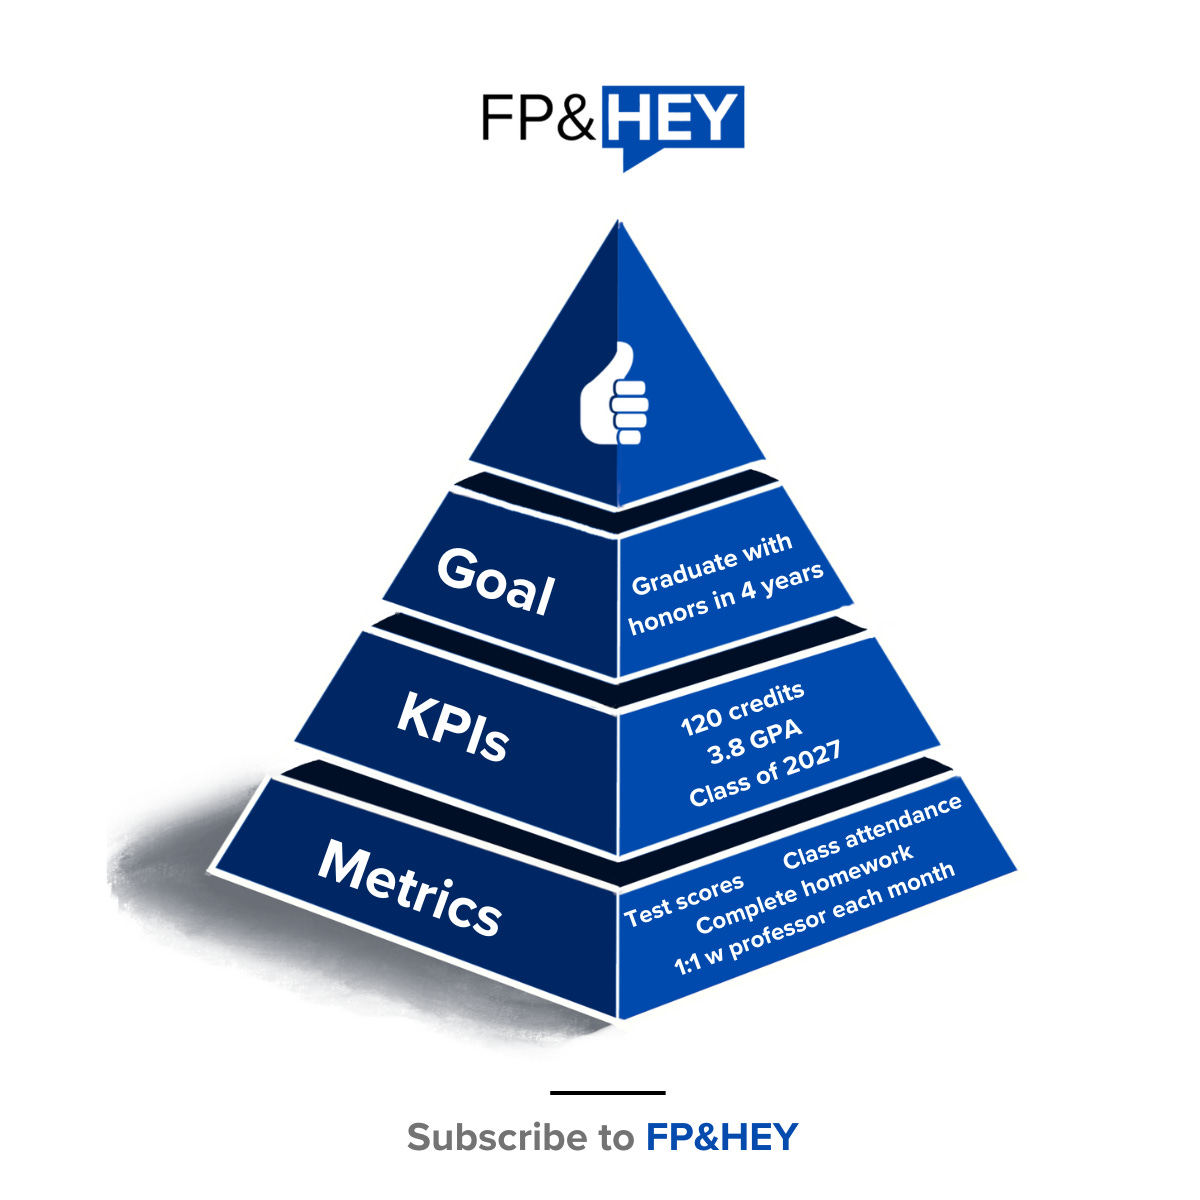
KPIs are goals in measurable form (i.e. numbers).
You may not realize it, but your personal life is full of goals and KPIs.
For example:
Graduating from school with a degree, with honors, and by a certain date are goals with KPIs (and metrics) to support.
Subscribed
KPIs are foundational to being successful in everyday life and in business.
How do you know your company is achieving its Revenue goals?
Compare actual Revenue results versus the KPI that links to your company’s goal.
It’s why creating goals and KPIs during your Annual Planning process is so important.
🔥TIP: Here’s everything you need to know about KPIs.
Just don’t create too many.
Less Data = More Financial Handle
Driving your car is the perfect example of less is more.
Do you want to get to your destination without mechanical failure?
Of course you do.
That’s what your check engine light does for you.

ChatGPT lists out a number of reasons your check engine could go off:
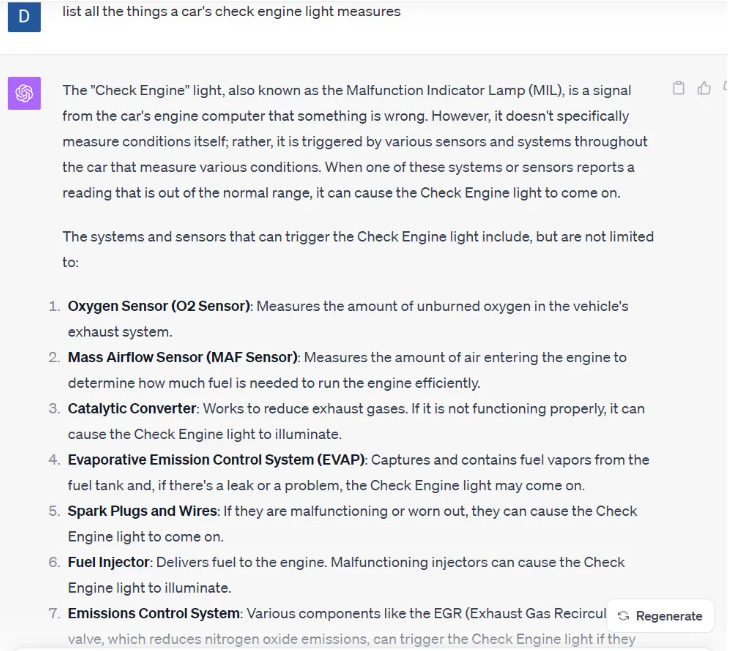
🔥TIP: Use ChatGPT to learn FP&A (and about cars) 2x faster.
The point is, ONE light is your indicator (KPI) for a bunch of important mechanical data that keeps you safe (goal).
That’s the art and science of great KPIs.
It’s why you should focus on a select few to help your CFO achieve financial handle (and sleep better).
KPI #1: Customer Count
The people and businesses that buy your company’s stuff are Customers.
Without them, your business fails (no Revenue, no cash, no paychecks).
They should be the primary focus of your company’s everyday decisions.

Customers can be classified by the following types:
- Businesses: Salesforce sells enterprise software to Businesses.
- Consumers: Nike sells athletic wear to Consumers.
Customers can also have different spending habits:
- Recurring: Verizon customers pay monthly for internet and phone service.
- Non-recurring: Amazon Fresh customers pay whenever they need food.
Ultimately, counting your customers is what matters.
And it’s your role to calculate in FP&A.
How to Calculate Customer Counts
Time to get your hands dirty with data.
First, we’ll assume your company has a Customer Count definition—every business does things differently.
If not, you in FP&A can help define it. 👊
In our example below, we’ll assume customer count is defined as any customer with Revenue associated with it where $ = product/service purchased.
Next, start by pulling a report with Revenue data by Customer for one month.
Then add a column to the right to calculate Customer Count for one month.

=if(B8>0,1,0)If Revenue in a given month is greater than 0, then that Customer records a 1 for Customer Count in that month.
You now know 42 Customers purchased something in October 2023.
Now pull in additional months and apply the same customer count logic.
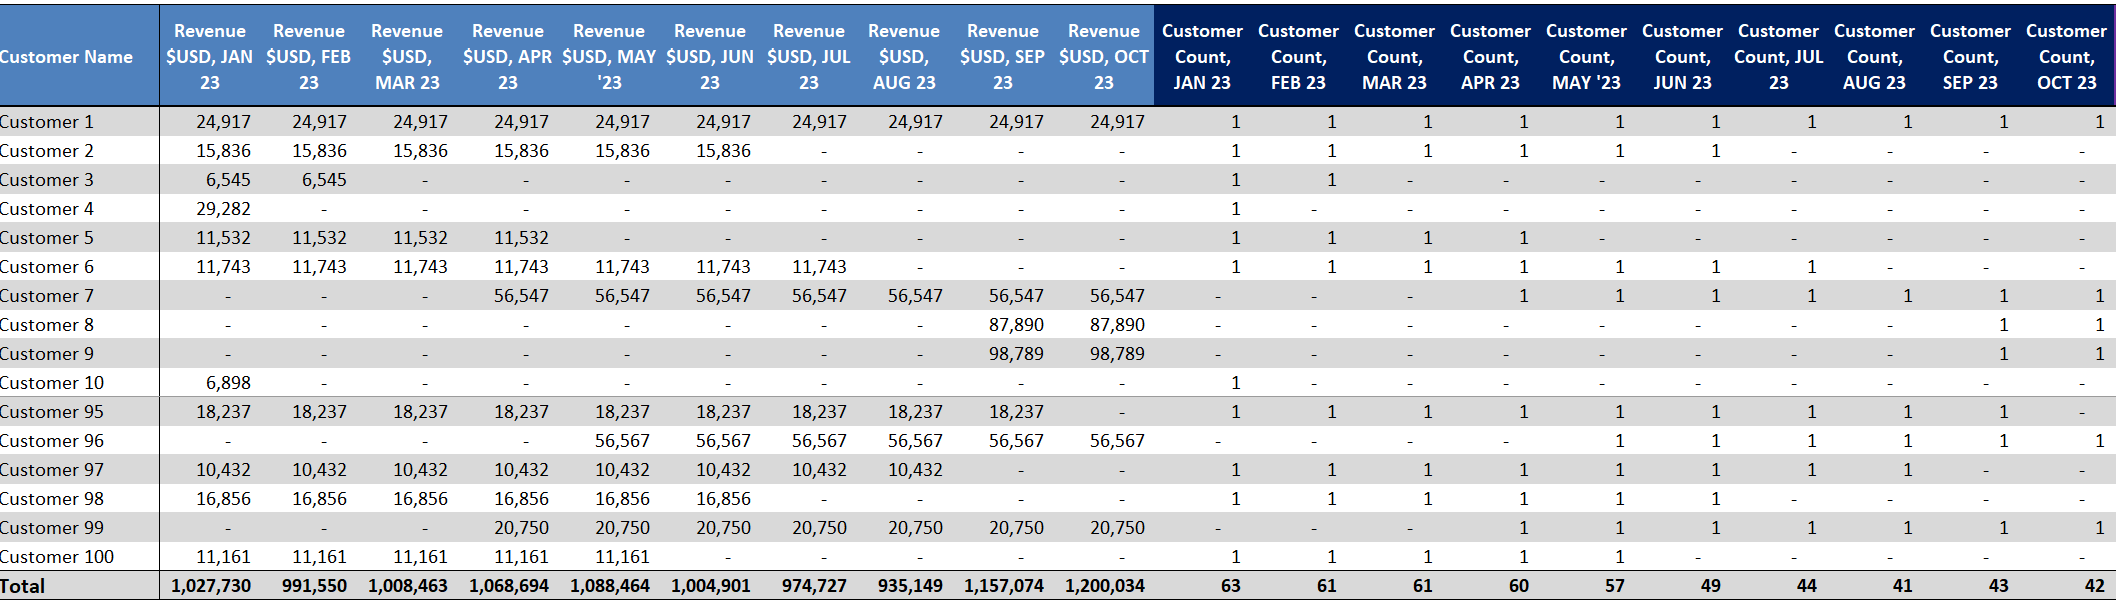
This data gets large very quickly.

Lose the magnifying glass.
Let’s get visual.
Ways to Visualize, Analyze, and Present
At first glance, you aren’t going to help your CFO sleep at night.
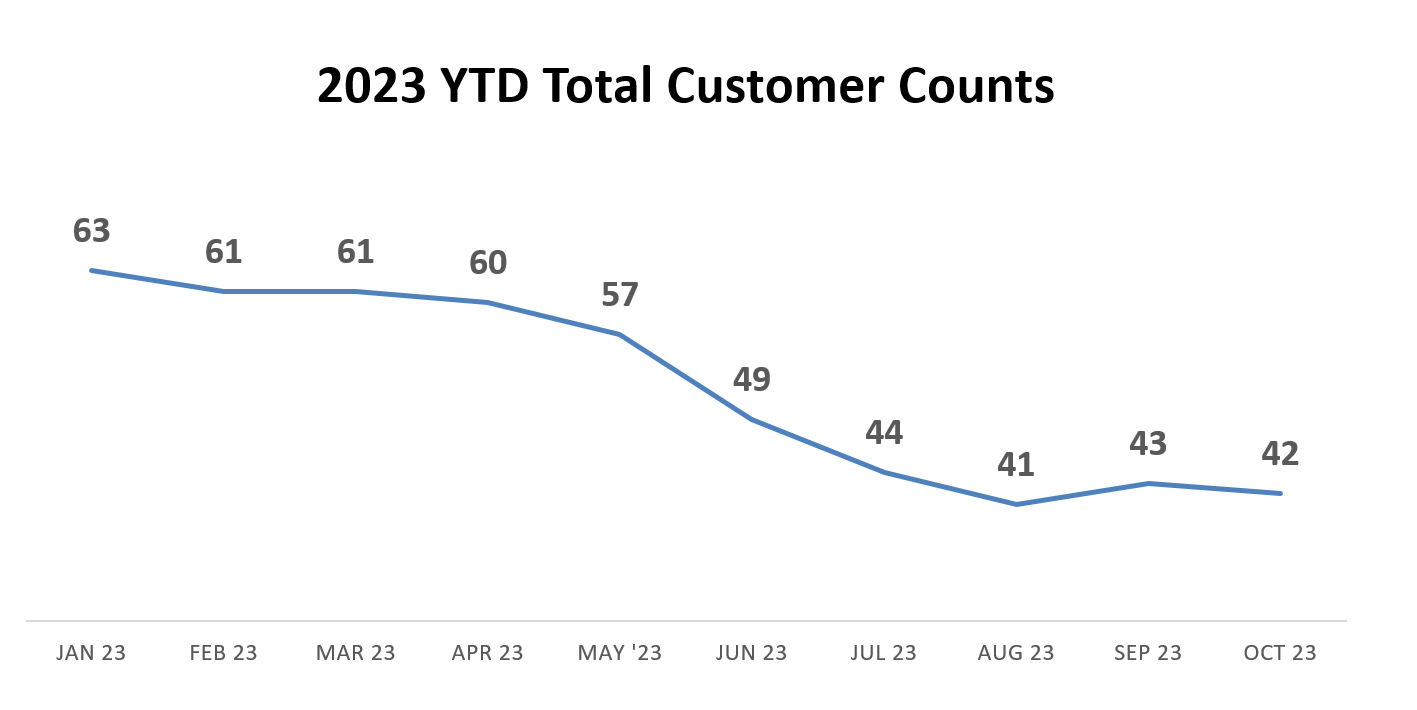
Customer Counts are going down month-over-month.

Let’s go deeper by understanding month-over-month New and Churn Customer Counts in October 2023.
A New Customer is a Customer that did not have Revenue in September 2023 but did in October 2023.
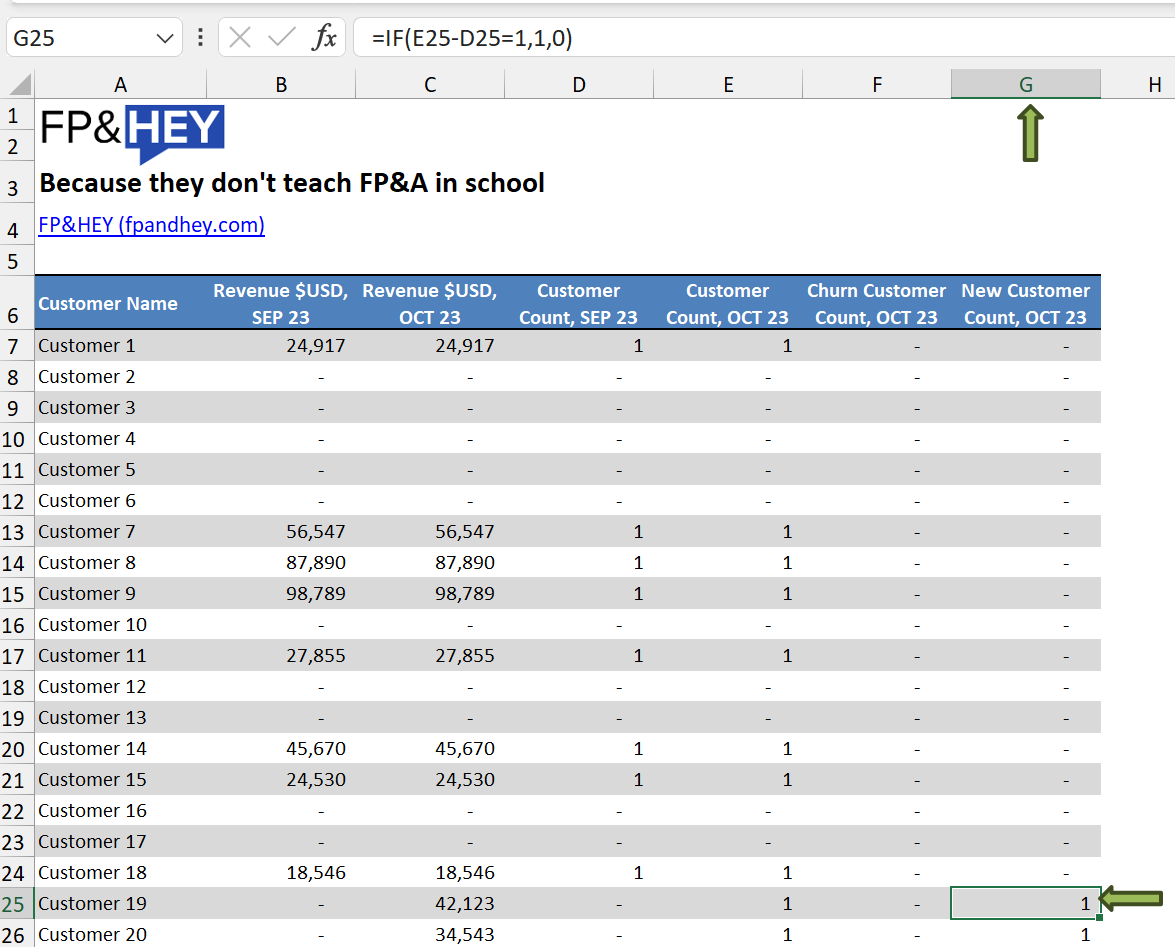
=IF(E26-D26=1,1,0)A New Customer will have a value of +1.
A Churn Customer is a Customer that had Revenue in September 2023 but did not in October 2023.
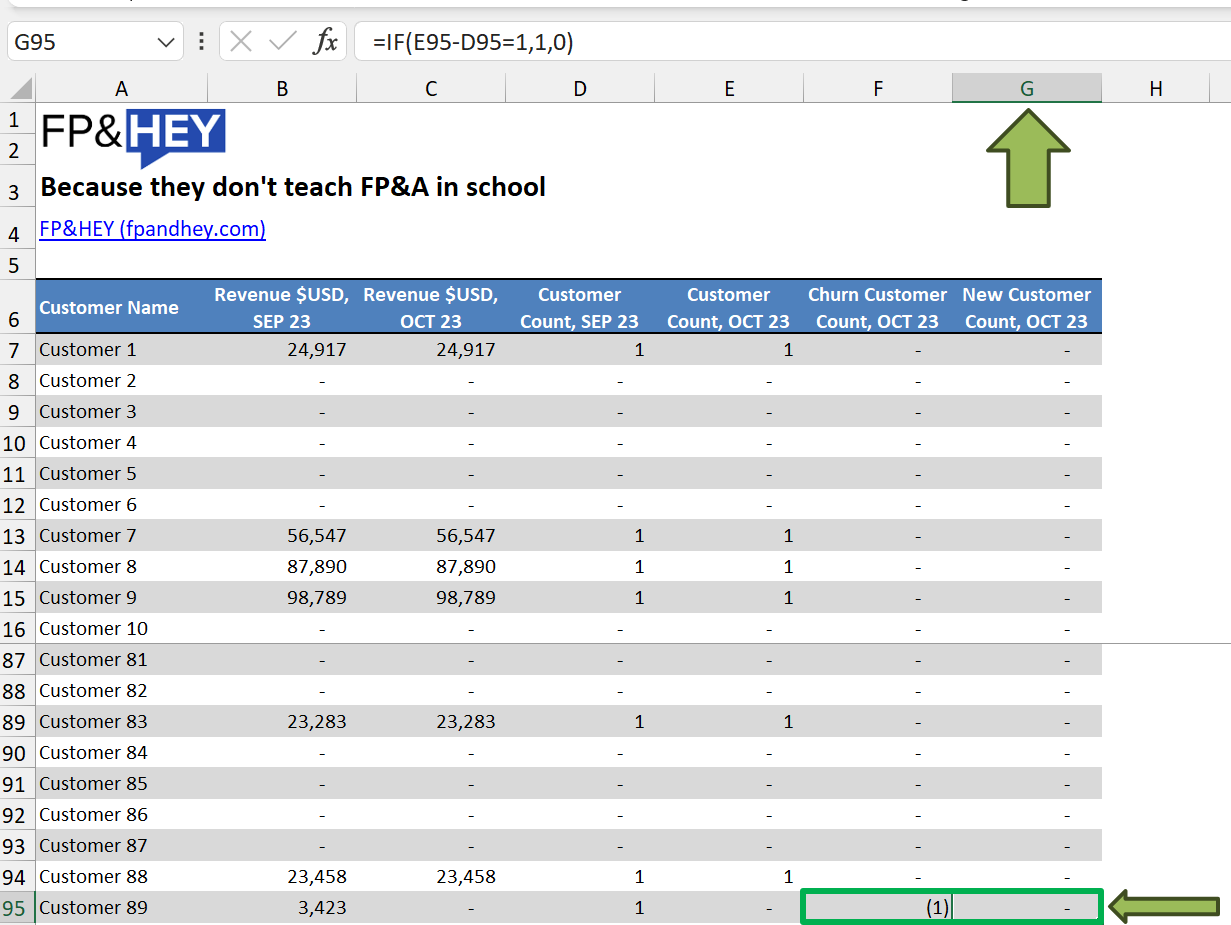
=IF(E96-D96=-1,-1,0)A Churn Customer will have a value of negative 1.
Now do this across all months.
That much data will cause eyes to glaze over quickly.

Visualize New and Churn Customer Counts over time with a simple chart.
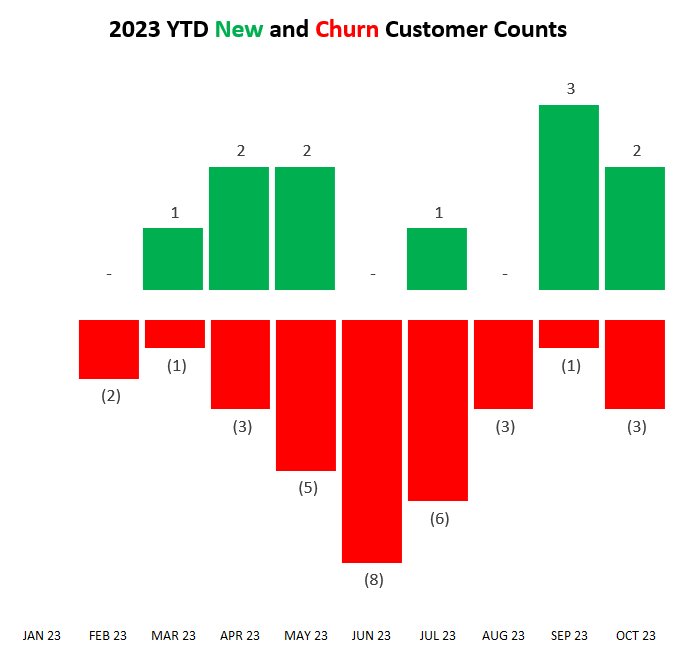
You notice Churn Customers are far greater than New Customers.

This is where you refer to your company strategy for 2023.
To increase profits, your company chose to terminate contracts with Customers that had low pricing (i.e. Revenue per Customer).
It’s in your Company’s Annual Plan you helped create and drive. 😉
🔥TIP: Read our Annual Planning scary stories to cheer you up if you’re in it now.
These Customers generated lower Profit and your company wants to maximize Cash Flow without investing heavily in Sales and Marketing.
Okay, so maybe this data isn’t all that crazy.

Time to confirm Revenue per Customer is growing.
KPI #2: Revenue per Customer
Your company wants to capture value.
Value = Revenue
Customers may pay list price (i.e. zero discount).
Or they may be harsh negotiators and demand high discounts.
This KPI will help your CFO understand how much value your company captures for every paying customer.
Pricing is its own art and science that can be part of your FP&A career journey.
🔥TIP: Here’s everything you need to know on diving into Pricing Strategy.
How to Calculate Revenue per Customer
You already have Revenue and Customer Count data.
Time for some serious algebra.
Here’s how to calculate Revenue per Customer:
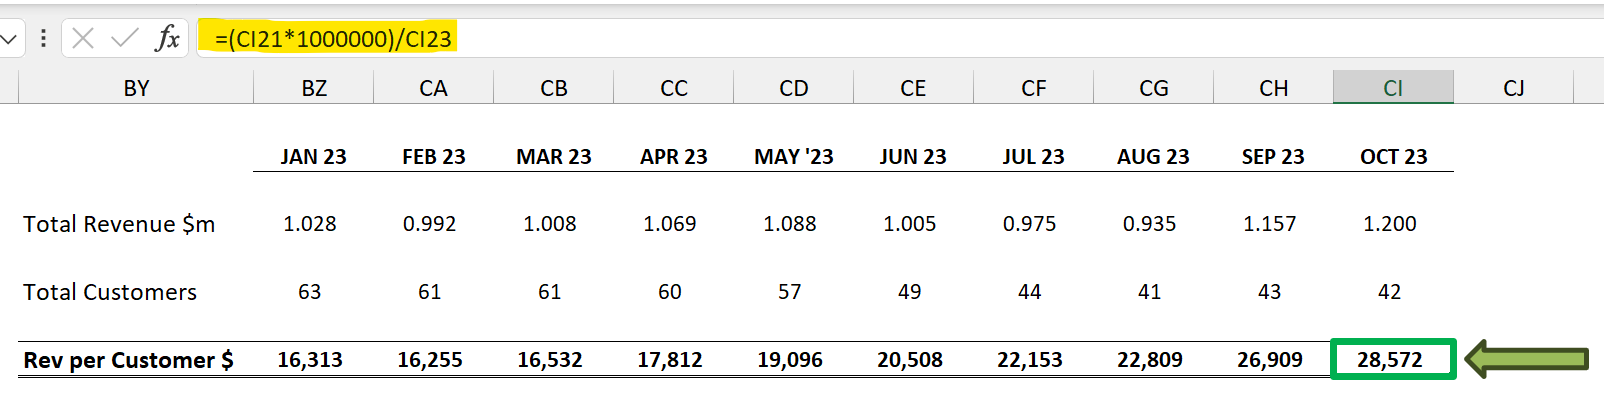
=(CI21*1000000)/CI23Revenue per Customer = Revenue divided by Customer Count
If you can scale Revenue by $1 million, ensure you can also unscale it.

Ways to Visualize, Analyze, and Present Revenue per Customer
Start by showing Total Revenue (a number your CFO wants to tie back to).
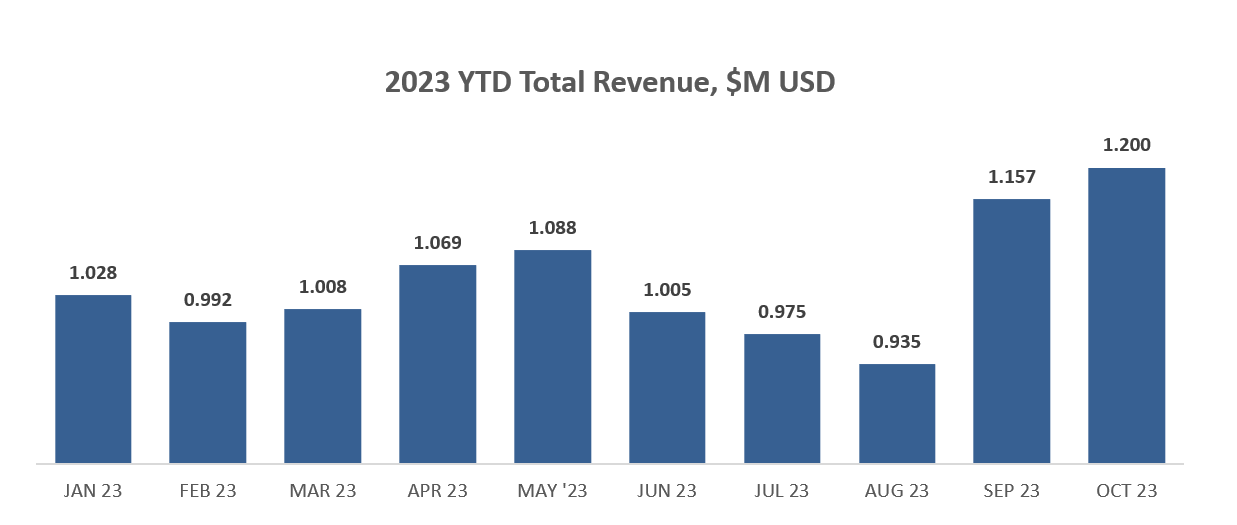
Then show the KPI Revenue per Customer.
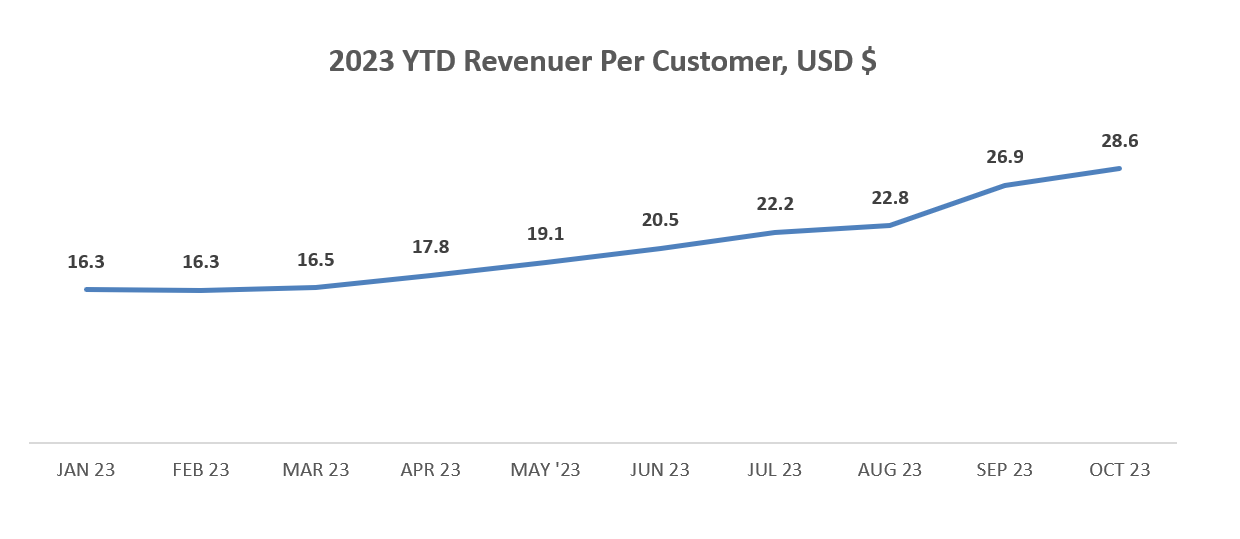
The trend is going in the desired direction (up and to the right). 💪
To further understand month-over-month Revenue and Revenue per Customer performance, leverage Volume, Mix, and Price (VMaP) analysis.
🔥TIP: Here’s a step-by-step guide to performing VMaP analysis.
Now it’s time to confirm that pricing increases led to higher profit margins.
KPI #3: Gross Margin Percentage (%)
Gross Margin % (GM%) states that, for every $1 USD of Revenue earned, you will make a percentage of that in ongoing profit.
It’s a metric that helps your CFO understand the ongoing profitability of your company before considering OPEX items such as:
- Acquisition costs (Sales and Marketing)
- Development costs (R&D)
- Administrative costs (Finance, Legal, HR, IT).
Gross Margin % is critical to your business because if it’s either too low, at zero, or below zero, your business model doesn’t work.
It’s just a matter of time before your company goes belly up like WeWork.
To understand this KPI, start with Revenue and deduct all costs related to providing or servicing your product and/or service to your Customers.
How to Calculate Gross Margin %
Depending on your company, your ongoing costs could be labeled as:
- Cost of Revenue (COR)
- Cost of Goods Sold (COGS)
- Cost to Serve (CTS)
Your company will choose one of these names depending on industry and preference.
Things that go into these ongoing costs include:
- Raw Materials
- Direct Labor
- Shipping Costs
- Plant (labor, rent, equipment, utilities)
- Data Center (rent, servers, utilities)
- Customer Support
- Service Delivery
Your Gross Margin % calculation will look like this:
Gross Margin % = (Revenue LESS Cost of Revenue) divided by RevenueNote: Gross Profit is Revenue LESS Cost of Revenue.
You can then easily take Gross Profit divided by Revenue to get your Gross Margin %.
Now throw this KPI in a chart.
Ways to Visualize, Analyze, and Present Gross Margin %
Your financial statements may already have Gross Profit and Margin available.
If not, start tagging departments and accounts for COR items.
This is how you would approach deep-diving COR to understand what drives costs higher and lower.
🔥TIP: Use VLOOKUP or XLOOKUP to tag data in groups like Cost of Revenue.
Now go forth and gather your Revenue and COR data.
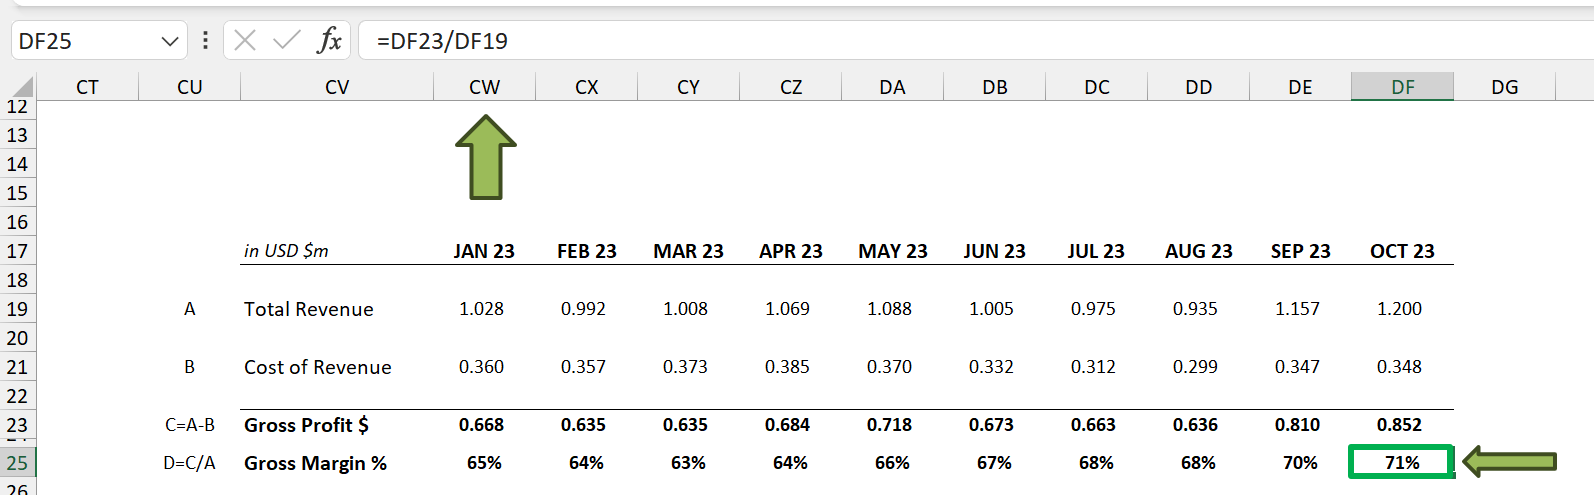
=DF23/DF19Grab your Gross Margin % by dividing Gross Profit by Revenue.
Then place it on a chart like below:
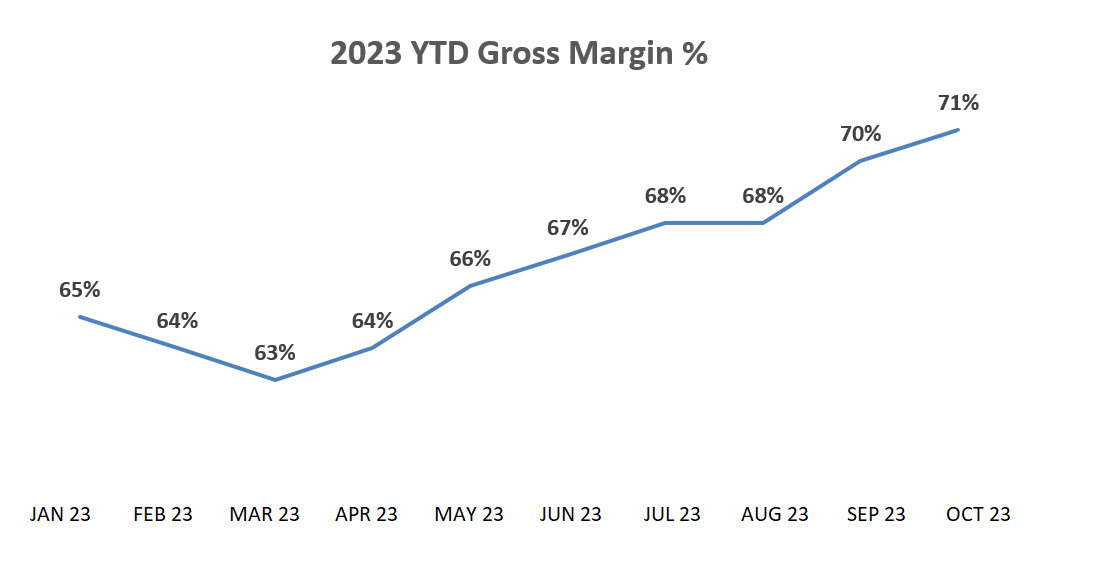
Great news for you and your CFO.
Gross Margin % is increasing throughout 2023.

Your company is crushing its KPIs.
Which means it’s crushing its goals. 💪
Conclusion: You are Your CFO’s Best Sleep Aid
Congrats! You can now sit down with your CFO and give them the gift of financial handle.
Your career prospects will grow as you become the go-to FP&A person for financial reviews.
All of this takes practice and time:
- Pulling data
- Visualizing trends
- Finding insights
- Communicating to Leadership and Business Partners—clearly and confidently
The good news?
You absolutely can do this.
Be patient, be confident, and have fun in the process.
Ready to give your CFO a great night’s sleep using these 3 KPIs?
Any other KPIs we’re missing?
Email us here with your experiences and thoughts.
Now go have fun making an impact on your business and your career!
Cheers,
Drew & Yarty
Follow us on LinkedIn
PS: This post is made for humans, by humans 💪